


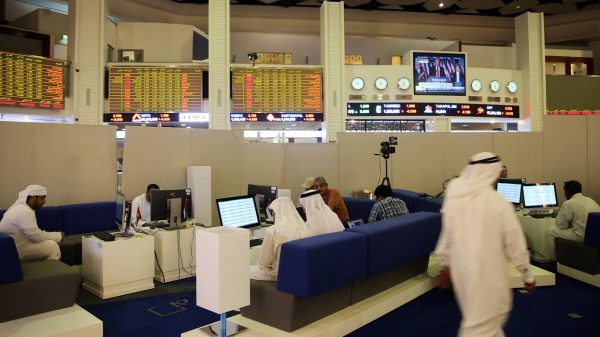


Asian stock markets (Asia Pacific, excluding Japan) have seen a decent recovery in the past 18 months. After such periods, there is a natural tendency to assume there will be a pause for breath.
This is when equity valuations can be helpful. When money has been invested when valuations were low, it has, historically, resulted in better returns over the very long term.
Of course, this past performance should not be considered a guide to the future and may not be repeated. There may also be short-term fluctuations which could reduce the value of investments.
As fund managers, we pore over a wide range of data and factors, devoting the most energy in analysing stocks on a case by case basis.
Below are seven charts that have caught my eye and help tell the Asian investment story.
Asia’s low price-to-book value
There are many ways to value stock markets. One of the stronger indicators is the “price to book” ratio. It compares the price with the book value or net asset value of the stock market.
A high ratio means a company or market is expensive relative to the value of assets expressed in company accounts. This could be because higher growth is expected in future.
A low ratio suggests that the market is valuing it at little more (or possibly even less, if the number is below one) than its accounting value.
The chart below shows that on a price-to-book basis, we are only back at the 10-year average and remain comfortably below the long-term average.
And this is at a time when earnings are improving.
Asia’s low trailing price-to-earnings ratio
This brings us on to the more widely reported price-to-earnings ratio. This commonly used measure involves dividing a stock market’s value by the aggregate earnings per share of all its companies over the past 12 months. A low number suggests better value.
Corporate earnings for Asian markets have been revised up amid an extremely positive macroeconomic backdrop. Valuations have followed suit, starting an upward ascent. It reflects a continuing improvement from the ultra-low valuations we witnessed two to three years ago.
However, stock markets are still not expensive compared to the long-term average, as the chart below shows.
Valuations as a standalone factor, therefore, are unlikely to pose a meaningful obstacle to markets from here.

Asia equities are cheaper than developed markets
Asia continues to trade at a discount to the rest of the world. Looking at forward price-to-earnings (PE) of Asia versus developed markets, you can see it is trading at a discount (shown as the blue line in the chart below).
Many investors would say this is because Asia is full of lowly-rated sectors which drag down overall valuations.
That is why we are highlighting the green line in the chart. This strips out this sector distortion by adjusting for different sector weights between Asia ex Japan and global developed markets. Even on this basis we can see the region is trading at a reasonable discount.
- Take a quick investment intelligence test: investIQ
Not since 2004 has the discount been so wide and interestingly, that that was the last period when US interest rates were rising. At the time, this cycle was mistakenly cited as a headwind for Asia. In actual fact, Asian markets re-rated upwards versus the rest of the world and ended up at a premium.

Affordable dividend payments
Amid all the talk of reasonable valuations in Asia, it can be easy to miss another positive trend unfolding in the region – the increasing ease with which companies can afford their dividends.
Companies in Asia have exerted better discipline on spending in recent years. The rate of capital expenditure (capex) as a percentage of sales has fallen, as the first chart shows, below.
This is indicative of the level of discipline that has been instilled into Asian companies over the years. They are much more focused on achieving returns from their capex investments than they have been historically.
This could still improve. The middle chart shows that capex relative to dividends is still relatively high in Asia compared to other regions, suggesting there is room for improvement.
The result of these trends is a welcome increase in cash flow, shown in the chart to the right.
Stronger cash flow enables a company to pay down debts or hand more money back to investors via higher dividends. Companies with higher free cash flow can more easily afford their dividends, which is the pattern we’re seeing in Asia.

And finally… high dividends
It’s not just a story of the affordability of dividends improving – income is already high.
Our final chart shows a dividend yield in excess of 2.5% easily exceeds what is on offer in the mature markets of the US and Japan.
In short, Asia offers not only growth potential and reasonable valuations but income that is high and has been growing.

Important Information: The views and opinions contained herein are those of Matthew Dobbs,Fund Manager, Asian Equities & Head of Global Small Cap, and may not necessarily represent views expressed or reflected in other Schroders communications, strategies or funds. This material is intended to be for information purposes only and is not intended as promotional material in any respect. The material is not intended as an offer or solicitation for the purchase or sale of any financial instrument. The material is not intended to provide and should not be relied on for accounting, legal or tax advice, or investment recommendations. Reliance should not be placed on the views and information in this document when taking individual investment and/or strategic decisions. Past performance is not a guide to future performance and may not be repeated. The value of investments and the income from them may go down as well as up and investors may not get back the amounts originally invested. All investments involve risks including the risk of possible loss of principal. Information herein is believed to be reliable but Schroders does not warrant its completeness or accuracy. Reliance should not be placed on the views and information in this document when taking individual investment and/or strategic decisions. Some information quoted was obtained from external sources we consider to be reliable. No responsibility can be accepted for errors of fact obtained from third parties, and this data may change with market conditions. This does not exclude any duty or liability that Schroders has to its customers under any regulatory system. Regions/sectors shown for illustrative purposes only and should not be viewed as a recommendation to buy/sell. Issued by Schroder Investment Management Limited, 31 Gresham Street, London EC2V 7QA. Registration No. 1893220 England. Authorised and regulated by the Financial Conduct Authority.
[contf]
[contfnew]

CityAM
[contfnewc]
[contfnewc]
The post Why consider investing in Asia now? Seven charts that tell the story appeared first on News Wire Now.


